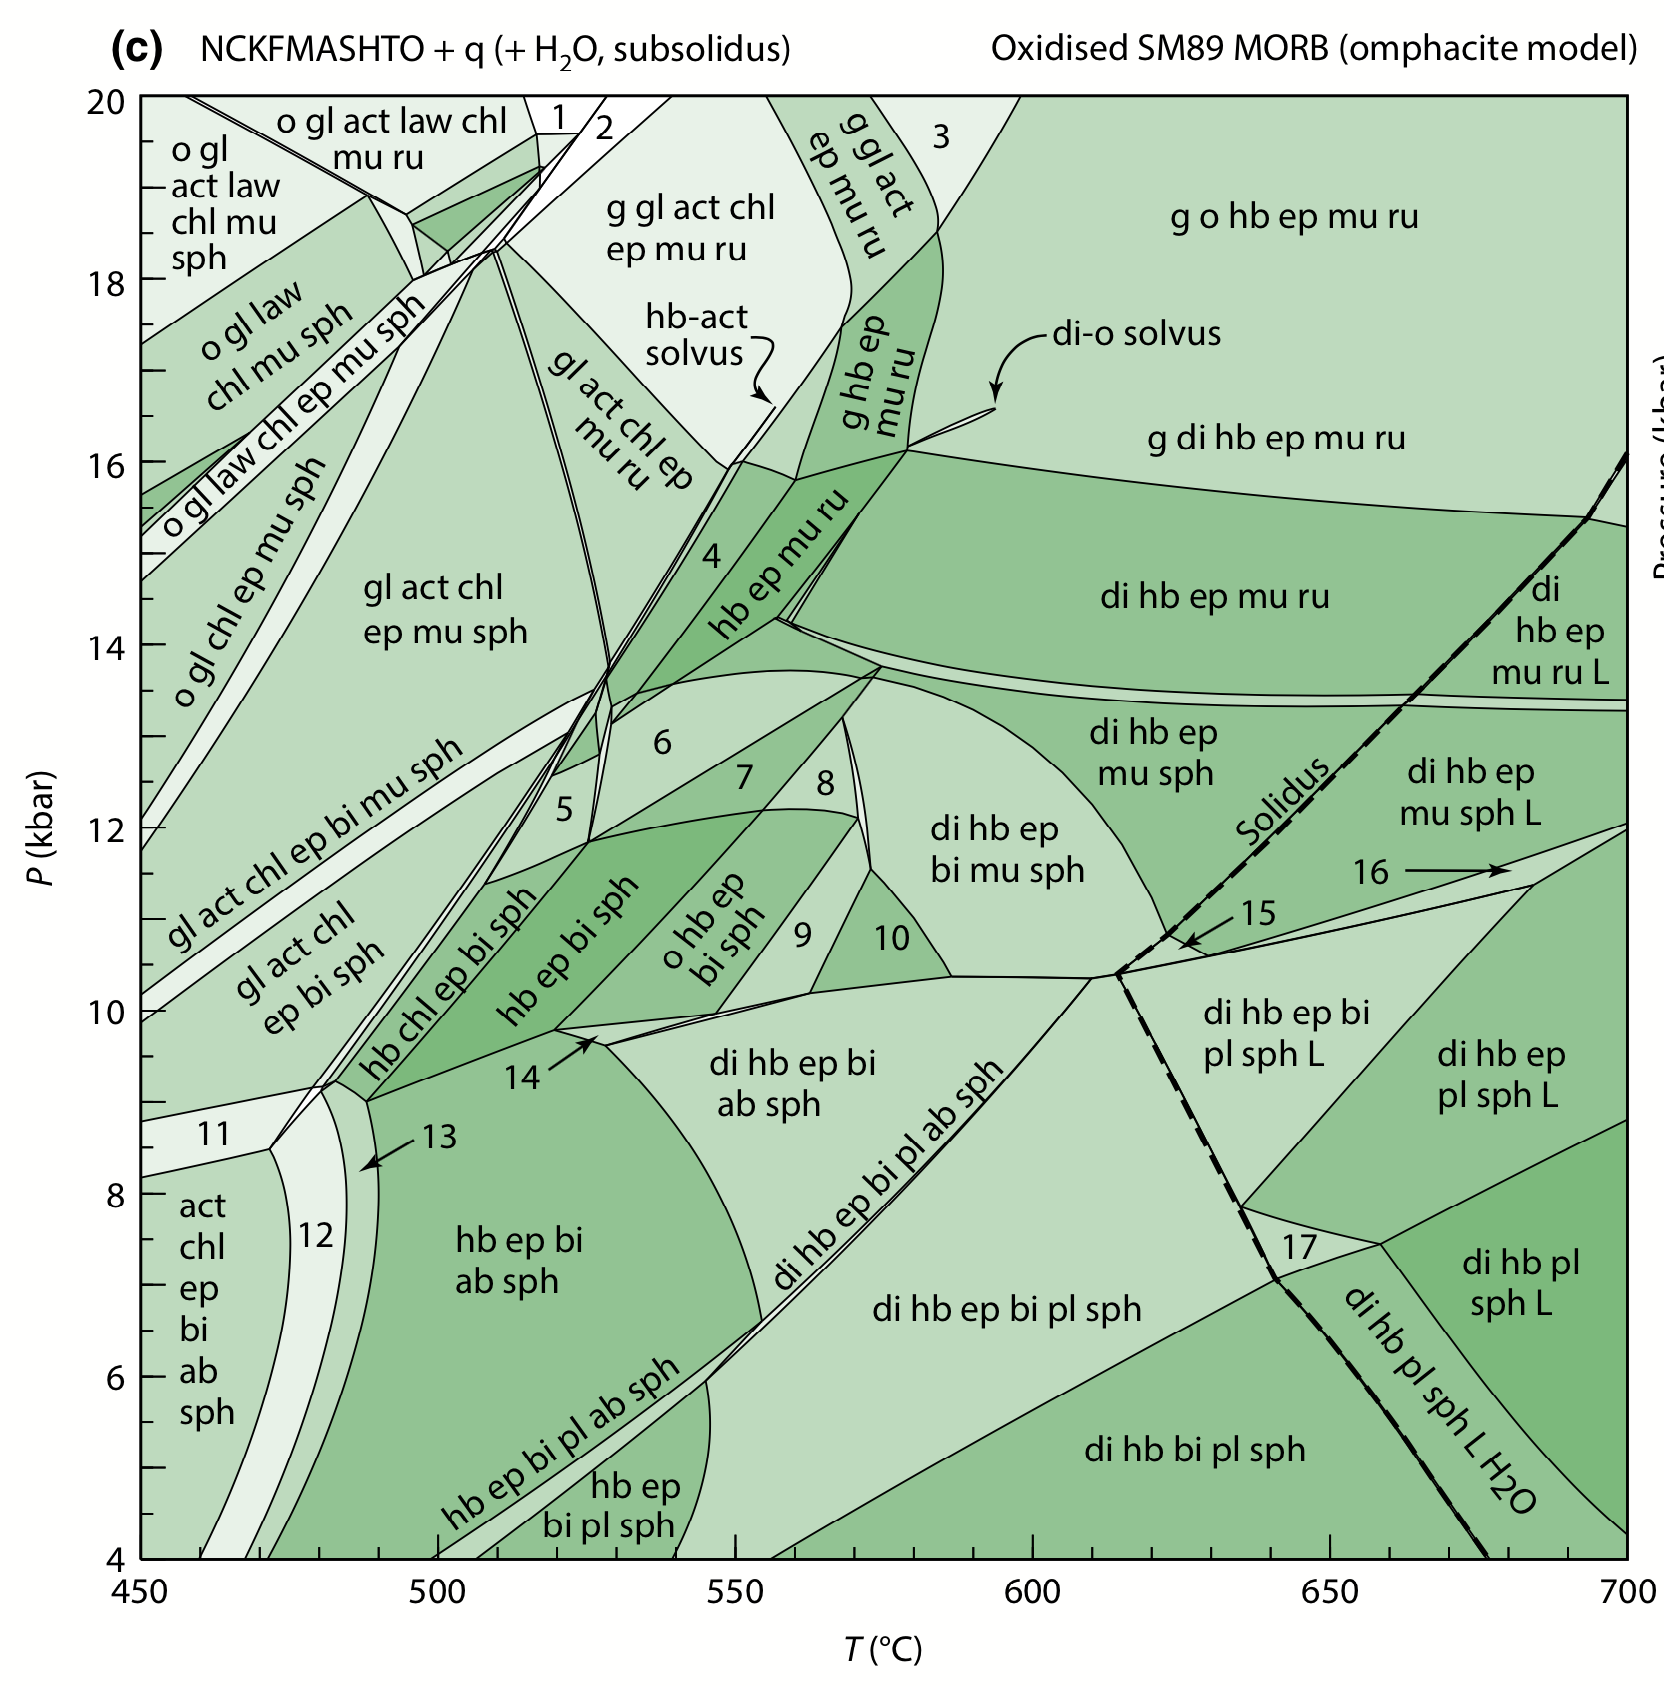
Fig. 2c of Green et al. (2016)

Equilibrium phase diagram calculated with Domino (Version 11.03.2020)
| Christian de Capitani | Version 11.03.2020 |

Fig. 2c of Green et al. (2016) |

Equilibrium phase diagram calculated with Domino (Version 11.03.2020) |
The bulk is SM89, taken from Table 1 of Green et al. (2016), with excess H2O. So the
comparison is only for the subsolidus region.
15 solutions were included, and all Fe3+ phases were considered.
The database is tcds62cid from the 11.03.2020 distribution, (iron and microcline excluded),
If you want to test different solution models or databases, the THERIN-file is: (for copy/paste):
! -----Version: 03.11.2020
    500     18000
1   SI(52.47)TI(1.05)AL(18.20)FE(8.15)MG(12.71)CA(12.21)NA(5.22)K(0.46)O(1.47) H(100)SI(10)O(?)   *    SM89, Green, 2016
Version 11.03.2020 is faster than previous versions, because it stops the calculation,
when minimum is only approximately reached.
Further tests will show if this is reasonable.
There are only few obvious failures (point clouds. stuttering lines) These are mainly close to
a narrow 3-amphibole field. (see
clipping)
For labeling the code '-1' was used: labeling solutions with the dominant endmember.
This will produce several (many) "apparent reactions" representing compositional variations of a solution,
which is a minor inconvenience, but is much more robust when exsolutions are involved.
e.g. reactions 20 and 5 (bottom center and left) are simply the change in epidote
composition from cz-rich to ep-rich and reaction 128 (top right) is the CPXo composition varying
from om-rich to di-rich and 147 the amphibole from parg to gl etc.
For more details, this example, including scripts and all output files can be downloaded here
The calculation with Domino took about 24 hours (MacBookPro14,3, 3.1 GHz Quad-Core Intel Core i7) and
about 26 hours (MacBookPro13,1, 2 GHz Dual-Core Intel Core i5)
While you wait for the program to finish, here are some
suggestions
of what you might do in the meantime.